
The purpose of this post is two-fold.
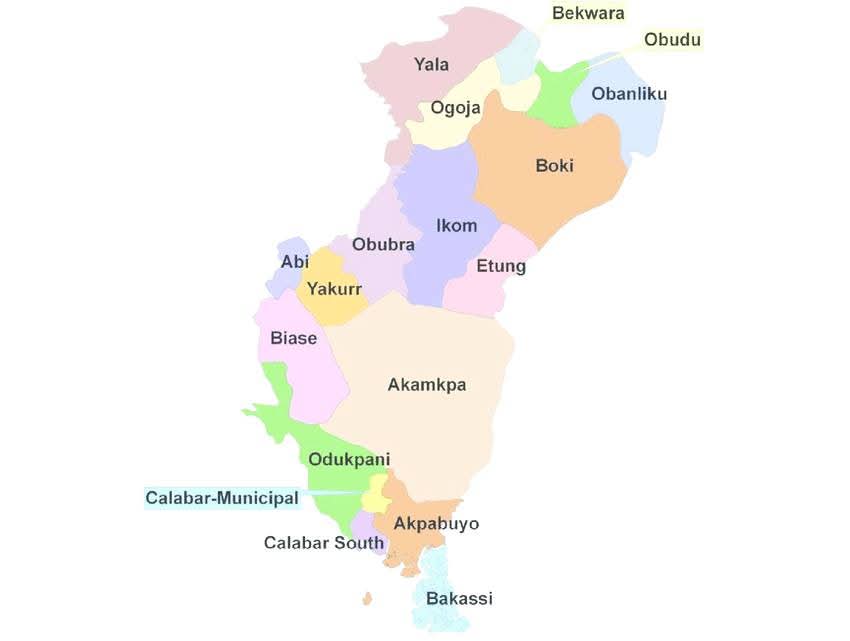
First, it is intended to provide enlightenment as to the true lay of the land regarding the actual landmass sizes of the eighteen (18) Local Government Areas in Cross River State. I am certain that not a few of us will be mildly surprised at the actual statistics given perhaps some of our preconceived notions about what we may have thought the sizes to be.
Second, I am persuaded that the information and data could come in handy for planning infrastructure development and other socio-economic purposes in our State. While the information has always been there in official publications, experience has shown that scant attention is actually given towards mainstreaming such useful metrics into the planning and development process.
CROSS RIVER STATE TOTAL LANDMASS: 21,636.596 Km2
LGAs Landmass Breakdown:
S/N LGA LANDMASS AREA IN SQ.KM RANKING
1. Akamkpa LGA 5,049 km2 1st
2. Boki LGA 2,805 Km2 2nd
3. Ikom LGA 1,984 km2 3rd
4. Yala LGA 1,763 km2 4th
5. Odukpani LGA 1,366 Km2 5th
6. Biase LGA 1,323 km2 6th
7. Obubra LGA 1,127 km2 7th
8. Obanliku LGA 1,070 km2 8th
9. Ogoja LGA 985 km2 9th
10. Etung LGA 823 km2 10th
11. Akpabuyo LGA 813 km2 11th
12. Yakurr LGA 676 km2 12th
13. Bakassi LGA 462 KM2* (2006 Census) 13th
14. Obudu LGA 459 Km2 14th
15. Bekwara 310 km2 15th
16. Abi LGA LGA 284 Km2 16th
17. Calabar South LGA 185 km2 17th
18. Calabar Municipal LGA 142 km2 18th
Source(s): Data was extracted from official sources including the 2006 Census publications.
*Note: While all other areas remain true to stated size, Bakassi LGA is likely to deviate in current actual size as a fallout of the ICJ Judgement and the ceding of a chunk its land area to Cameroun.
Viva Cross River State!
Ceejay Ojong
Abuja
21.05.2020